Following the
empirical recipe suggested by M. Kitzbichler we checked if a
brightening of satellite galaxies (ie. Type 1 and 2) by a factor:
1 N(z) of groups
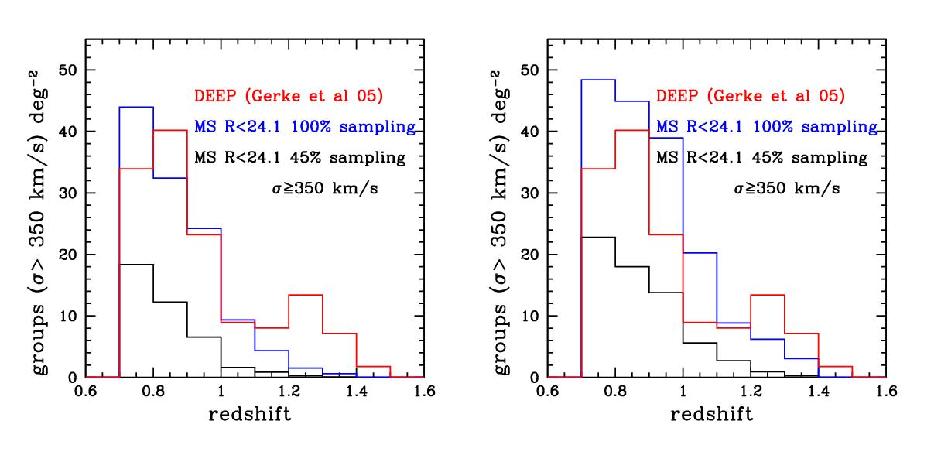
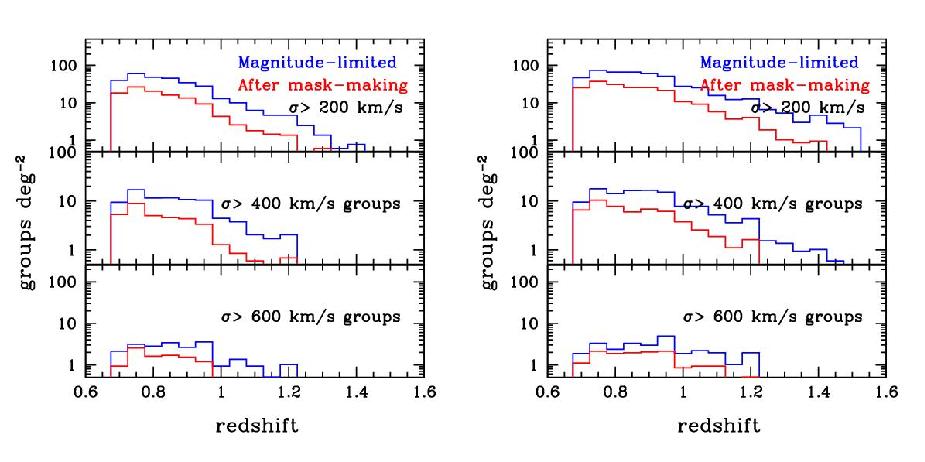
Plot #2 shown N(z) of groups in Millennium and in the DEEP2 catalogue (Gerke et al. 2005), without (on the left) and with (on the right) brightening applied.
The discrepancy between MS and the DEEP2 groups catalogue when a realistic sampling rate is considered is still there, albeit a bit reduced.
Plot # 3 shows the results obtained, for the same quantities, from each of the 6 cones considered. There is scatter in the results, but not enough to reconcile with observed data. Also notice that the high-z tail is still missing in the simulations.
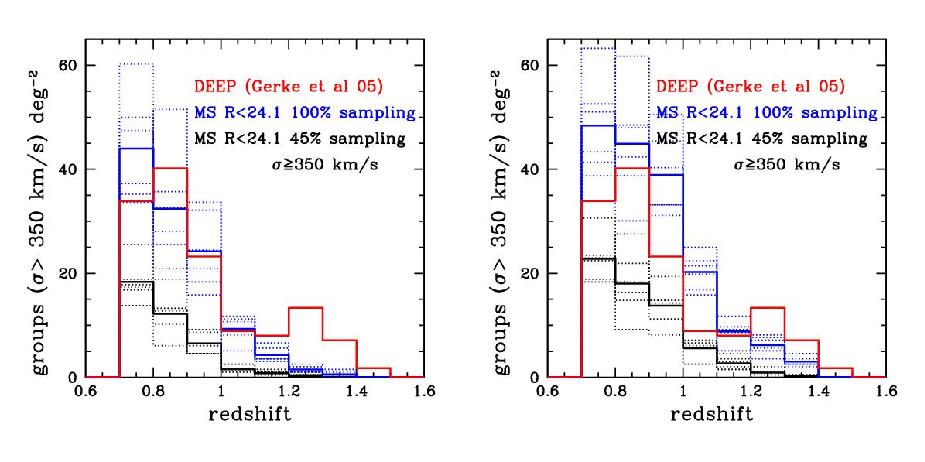
PLOT # 2 & #3
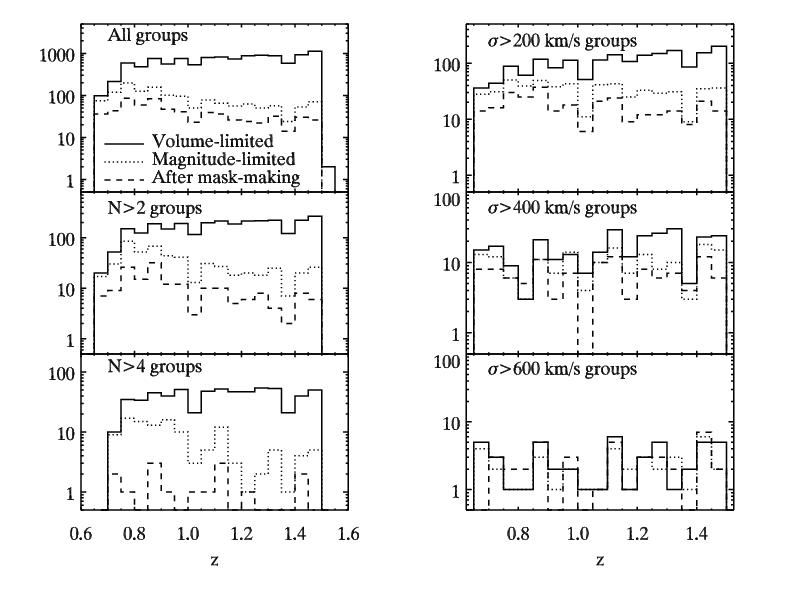
2Comparison with simulations used in Gerke et al. 2005
We decided to compare the results from our MS with those shown in Gerke et al 2005 (its figure 2). That figure shows the predictions in terms of expected groups (per square deg, as the DEEP2 fields total 120X30 arcmins) for various mocks obtained from the Yan et al. (2003) simulations. Plot # 3 shows the original plot from Gerke et al. (2006), and we can compare their results for Magnitude limited and for After mask-making mocks with those we obtained (using the same definitions for these two samples) from our MS mocks.
PLOT #4
Plots #5 and #6 show our results from MS (on the left before brightening, on the right after brightening).
PLOT #5 & #6
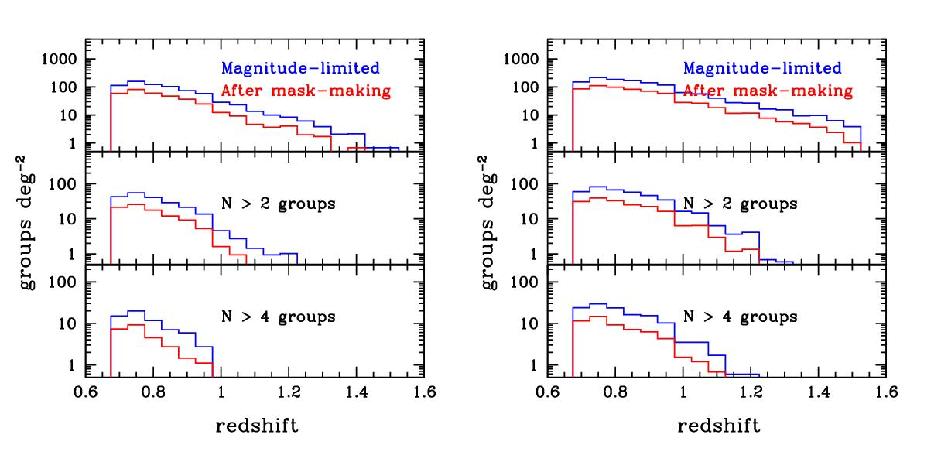
Also with the
brightening (plots on the right) there is a small number of groups
after redshift ~1 in the MS,
even
when considering the simply magnitude limited sample, whereas the Yan
et al. (2003) simulations predict a non negligible number of groups
even at z ~ 1.4.
 back to
deep2
vs MS comparison page
back to
deep2
vs MS comparison page