This
document presents a short comparison of the properties of groups in
the Millennium
simulations (MS) and those of the catalogue of groups presented by
Gerke et al. 2005.
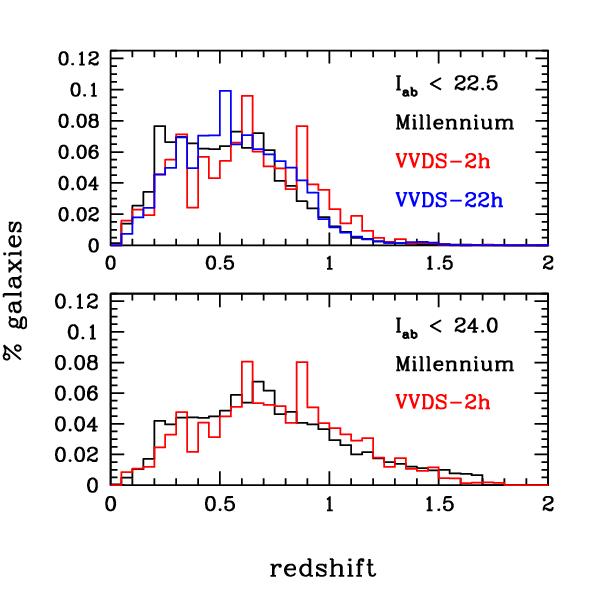
We used 6 MS cones, totalling 11.76 sq degs and considered two magnitude limited samples: at I_AB <= 24.0 (VVDS like) and R<=24.1 (DEEP2 like).
We extracted from the MS - DEEP2 like samples two further catalogues for each cone:
masked samples with 60% sampling rate and
observed samples with 45% sampling rate (see Gerke et al. 2005, where he quotes 60% as the 'number of suitable target galaxies that can be scheduled for observations' and 30% as the percentage of observed galaxies that 'cannot be assigned a firm redshift').
1 N(z) of galaxies
Plots # 1 shows N(z) in Millennium and in VVDS for the two limiting magnitudes shown in the figure. The agreement is reasonably good.
PLOT # 1
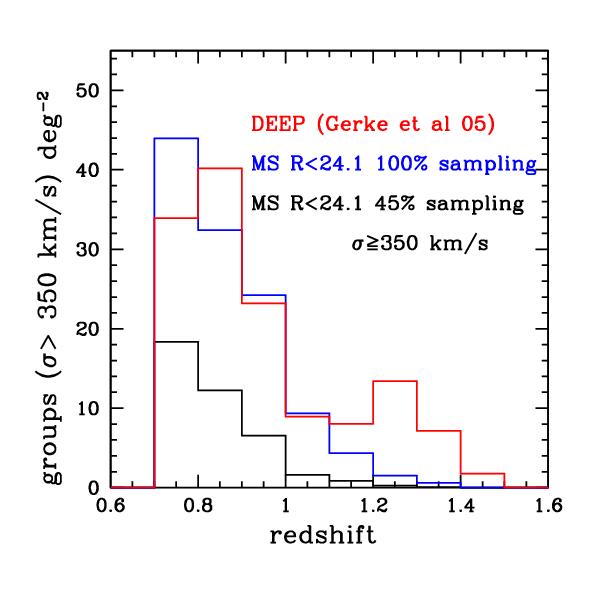
2 N(z) of groups
Plot #2 shown N(z) of groups in Millennium and in the DEEP2 catalogue (Gerke et al. 2005). The catalogue of ~ 150 groups presented in the Gerke at al (2005) paper lists groups with sigma >= 350 km/s and therefore in our plot we limited ourselves to such values for sigma in the MS. For comparison we have plotted groups in the MS both considering only a purely magnitude limited sample (R<24.1) and applying a realistic sampling rate of ~ 45% (see above).
There is a large discrepancy between MS and the DEEP2 groups catalogue when a realistic sampling rate is considered, while the simulations agree quite well with the observed Gerke et al 05 catalogue when the full r<24.1 catalogue is considered.
The discrepancy seems to be a bit too large to be due to cosmic variance. Plot # 3 shows the results obtained, for the same quantities, from each of the 6 cones considered. There is scatter in the results, but not enough to reconcile with observed data. Also notice that the high-z tail is missing in the simulations.
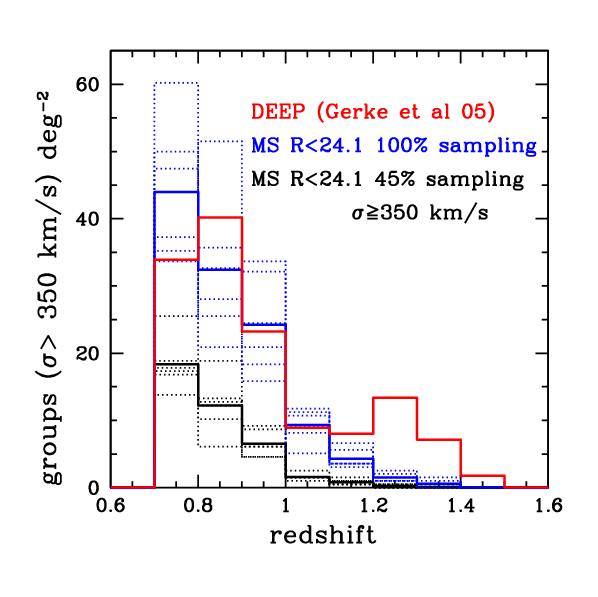
PLOT # 2 & #3
3 Comparison with simulations used in Gerke et al. 2005
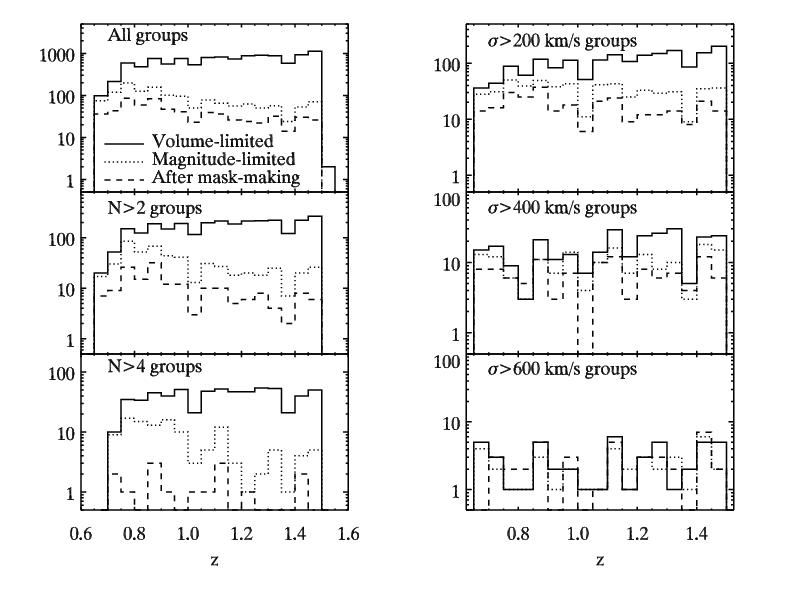
We decided to compare the results from our MS with those shown in Gerke et al 2005 (its figure 2). That figure shows the predictions in terms of expected groups (per square deg, as the DEEP2 fields total 120X30 arcmins) for various mocks obtained from the Yan et al. (2003) simulations. Plot # 3 shows the original plot from Gerke et al. (2006), and we can compare their results for Magnitude limited and for After mask-making mocks with those we obtained (using the same definitions for these two samples) from our MS mocks.
PLOT #4
Plots #5 and #6 show our results from MS.
PLOT #5 & #6
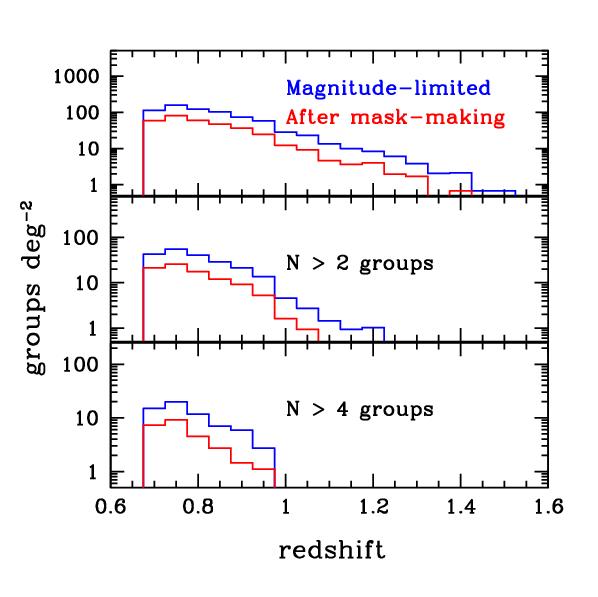
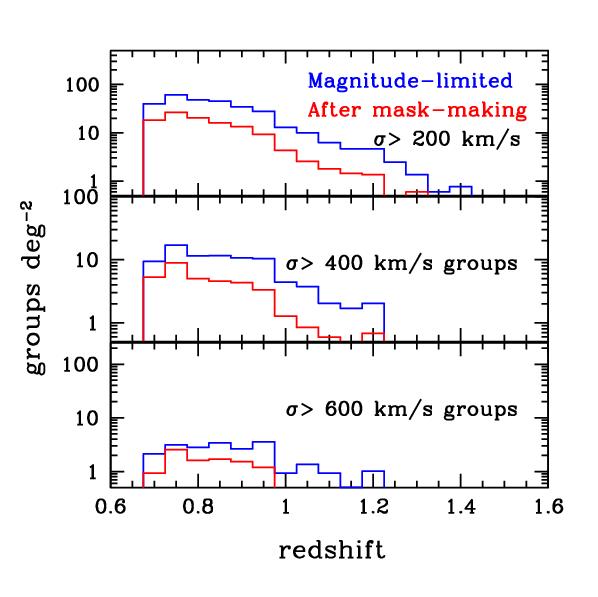
The most obvious difference is the smaller number of groups after redshift ~1 in the MS, even when considering the simply magnitude limited sample, whereas the Yan et al. (2003) simulations predict a non negligible number of groups even at z ~ 1.4. One should also remember that the After mask-making sample is still optimistic with respect to the final observed sample, where the further 70% incompleteness in measuring redshifts should be considered.
Therefore there seem to be a discrepancy between DEEP2 data (and the mocks they used) and the MS mocks in predicting the number of groups at z >1.
The discrepancy
is roughly a factor ~ 2 in the redshift range 0.7 – 1.0, and is
more pronounced at higher redshift.
More to come on this
page, following a possible empirical recipe,
suggested by M. Kitzbichler, that could help to resolve this
discrepancy....
Here are the results
obtained by applying the brightening of satellite galaxies (Type 1 and
2). The discrepancy becomes less pronounced but it is still
present.
 back to
main page
back to
main page