News from MY Universe
2002 June 20: holidays,
till september
2002
June 6: the largest CCD mosaic ever built by me (4o x 4o)
2002
May 23: a lot of clusters identified by the color-magnitude relation and
the X-ray emitting gas
2002 May 9: reorganisation of the
web pages!
2002
Apr 26: galaxies difficult to be seen
2002
Apr 11: mass segregation at z=0.3
2002
Mar 28: a very distant (z>0.8) cluster of galaxy
2002
Mar 14: distances using artificial intelligence
2002
Feb 28: how faint can be a galaxy ?
2002
Feb 14: optical+X-ray images to pick-up clusters at high redshift
![]()
2002
June 6: the largest CCD mosaic ever built by me (4o x 4o)
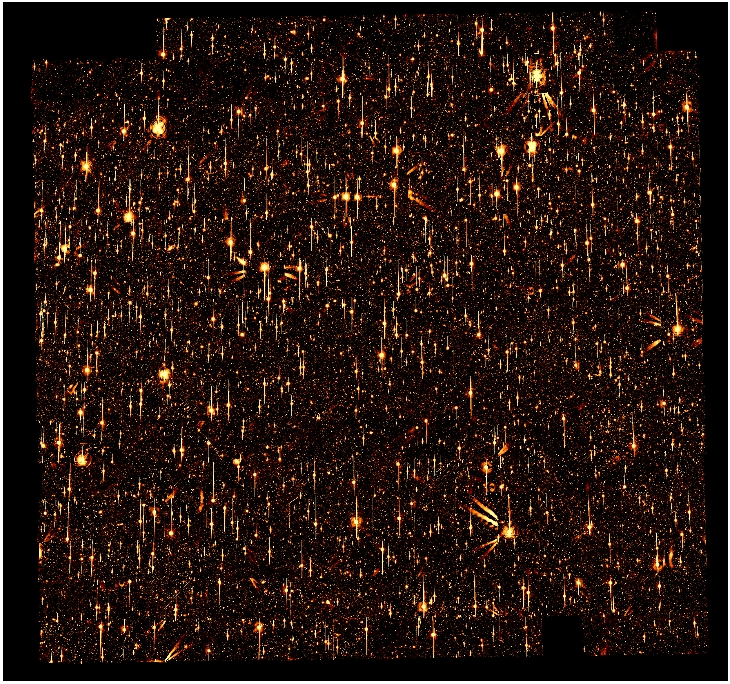
The image shows the KPNO/Deeprange
field. By using 253 images reduced by Postman
et al. (2002), I build the mosaic. It is 4o x 4o wide,
34k x 34k pixel wide, and takes ~4 Gbyte. In order to produce an
image that can be seen on the web, I resampled it putting 450 (original)
pixels in one. The vertical lines in the figure are due to
electrons escaped from the potential wells of the CCD pixels along the
CCD columns. For the second one largest mosaic ever built by me looks here.
2002
Apr 26: galaxies difficult to be seen
In the near-infrared (lambda 1-2 µm) the bright sky makes
difficult to see galaxies, even the brightest ones, since their brightness
is several times fainter that the sky brightness. It is much like to see
something with a strong bulbe lamp pointed to your eyes. In spite of these
observational difficulties several team started surveys of the sky in the
near-infrared, such as DENIS,
2MASS
, doing a great job. However, one never should forget the data
limits. After all, these two surveys exposed the sky for 1-3 sec, and for
diffuse objects, like galaxies, this means that their outer envelopes are
not detected. The figure shows the ratio between the flux measured by 2MASS
and by deep pointed observations of nearby (famous and bright) early-type
galaxies, many of which are taken from the NGC catalog, As it is obvious,
the ratio is seldom equal to 1 and often the fraction of lost flux can
be as high as 50 % or more. These galaxies are quite bright (K<11
mag) and of normal-high surface brightness. Galaxies of lower surface brightness
are even entirely missed by 2MASS.
2002 Apr 11: mass segregation at z=0.3
The near-infrared luminosity is a proxy of stellar mass, since
galaxies with different star formation histories and the same mass have
similar near-infrared luminosities. Galaxies can be classified, therefore,
in giant, if their mass exceeds some threshold value, and dwarfs. The figure
shows how many of giants there are per dwarf. At the cluster center, this
ratio is about 1, while outside the cluster core radius (250 Kpc for H0=50
km s-1 Mpc-1), the ratio is 0.3. This means
that dwarf galaxies tend to avoid the cluster center, or in terms of masses,
low mass galaxies avoid the cluster core. Such effect, called mass segregation,
is a natural outcome of the standard hierarchical scenario of cluster formation,
but was never been detected previously in such a direct way.
2002 Mar 28: a very distant (z>0.8) cluster of galaxy
Clusters of galaxies are the largest virialized
objects in the Universe. They are the most notable collection of galaxies
and contain many early-type galaxies, that share similar colors. Hence,
clusters can be recognized from other etherogeous collections of galaxies
by the presence of objects having similar colors. Clusters of galaxies
have large quantities of ionized gaz trapped in the potential well of the
clusters, that emit in the X-ray. Given the size of the clusters (1 Mpc)
and the resolution of the XMM-Netwon
telescope, clusters look as extended sources in the X-ray. The
picture show a very distant cluster of galaxies (z>0.8, conservatively),
previously unknown, as detected by means of two independent methods: as
an extended X-ray source (observed by the satellite XMM-Newton
by the XMM-LSS
consortium, shown as blue contours), and as overdensity of galaxies
having similar colors (marked with circles). The cyan square
marks the cluster detection. North is up, East is to the left.
2002 Mar 14: distances using artificial intelligence
The Sloan Digital Survey provides
fluxes and colors of millions of galaxies, and, for a subsample of them,
also distances (called redshits by astronomers). By using artificial intelligence
tools it is possible to estimate the redshift (distance) of the galaxies
without direct measures of distances. In short, a training set, composed
by colors and luminosities of a random subsample of galaxies with
redshift, is provided to a Multi-layer Perceptron, that learns from these
examples how these features are related to the galaxy distance. The neural
network is then validated on a independent validation set (need to avoid
overfitting), and finally tested on another independent data set. The figure
show the relation between the measured distance (zspec , unknown
to the neural network) vs the estimated distance (zphot) for
the test set. The dispersion around the one-to-one relation (i.e. zspec=zphot)
is 0.020, or 6000 km s-1.
2002 Feb 28: how faint can be a galaxy ?
The figure (Andreon & Cuillandre, ApJ,
in press) shows the luminosity function, in three filters (wavelengths),
of galaxies in the rich , famous and nearby Coma cluster. The luminosity
function is the number of galaxies of a given magnitude (luminosity). It
is well known that individual galaxies can be very faint, but are these
very faint galaxies rare examples or the rule? The figure shows that galaxies
can be as faint as 3 bright globular clusters, and that there are a lot
of such a galaxies, much more than brighter galaxies. These very low luminosity
galaxies exceed in number even dwarfs, that are quite common, that in turn
exceed in number giant galaxies. The hasded regions mark previous measurements
of the luminosity function. The hashed region in the lower panel is the
average over all literature luminosity functions preceding end of
year 1998.
2002
Feb 14: optical+X-ray images to pick-up clusters at high redshift
The picture shows a cluster of galaxy, VMF40 (Vikhlinin et al. 1998,
ApJ 502, 558), at z=0.6. The grayscale image is the R band image taken
with the MOSAIC (35'x35') camera at the 4m CTIO, by the XMM-LSS
consortium. The circles are clusters detected by using their red-sequence
(the original method is described in Gladders & Yee 2000, AJ
120, 1248), as modified by myself (Andreon 2002, in preparation). The contours
is the X-ray emission measured by PSPC on Rosat. There is a good agreement
between the "double" morphology of the cluster, pointed out by X-ray data,
and the "double" or even "triple" optical morphology. The color of
the red sequence locates the cluster at z=0.55, quite near the literature
estimated redshift of 0.6. The further circle in the bottom-left is a further
cluster without X-ray counterpart in the shallow (3.5 Ks) PSPC exposure.
The field of view is 11.5'x6.5'. North is up, East is to the left.