Here we present in some detail the procedure used to build catalogues that reproduce all the biases in slit positioning introduced by SSPOC, the slit positioning software.
SSPOC requires as input a catalogue file containing for each object its
1 ID,
2 Ra (dec degrees),
3 Dec (dec degrees),
4 Object radius in Dec direction,
5 MPS Flag (S=select, R=reference, C=compulsory, F=forbidden, A=arc),
6 Observed Flag (Y=observed, N=not observed).
As in the catalogues used to prepare the observations the stars were removed using photometric information, we can start directly by applying the SSPOC software to the Millennium simulations data (that contain only galaxies) after a simple i_ab=22.5 magnitude cut.
Unluckily the Millennium simulation files do not provide the Object radius information, and therefore we need to add for each object a realistic radius in arcsecs. We used the F02 VVDS data to check the typical object radius as a function of observed i_ab magnitude.
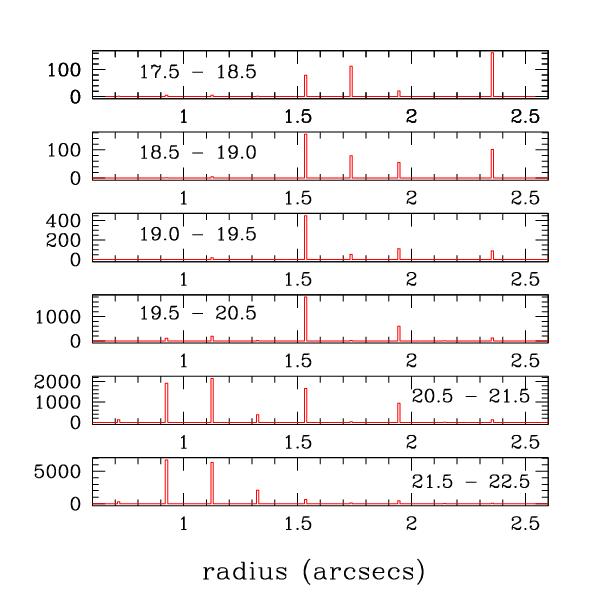
Plot #1 shows the histogram of radius as a function of apparent magnitude for the ~ 30000 galaxies in the F02 field for which we have photometric information.
PLOT #1
There is a clear discretization of values in multiple of the pixel size (0.2 arcsec), and a cutoff for values smaller than the seeing (~ 0.9 arcsec), evident for the faint objects.
We decided to get a linear fit for the median of the radius as a function of the magnitude and for its percentiles and then use a gaussian (with a cut-off value depending on the magnitude range) to attribute in a random fashion, to each galaxy in the Millennium catalogue its radius.
Plot #2 shows, in steps of 0.1 mags and in bins of 1 mag, the median and the 5/95 percentiles of the distribution (black points and red lines, respectively). In blue the linear fit to the median and to the 95 percentiles. These two lines provide the estimates of the mean and the 2*sigma of the distribution of radii to be used for each object to obtain its radius. A cutoff value of 0.9 arcsec is imposed if the estimated radius is smaller than 0.9 arcsec.
PLOT #2
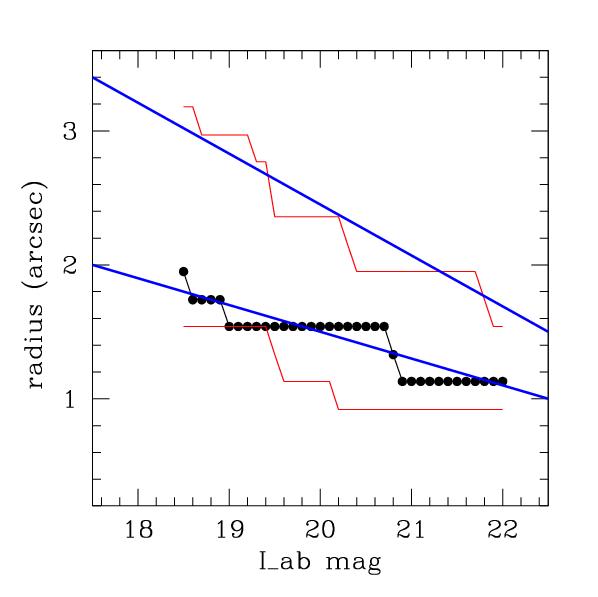
The two blue lines have the following functional form:
mean radius = -0.127*mag_I + 3.0
1*sigma: = -0.19*mag_I+5.
and are approximately those adopted to assign a radius to each object in the Millennium catalogue, together with a cut-off value of 0.7/1.1/1.5 arcsecs at m<21 / 21<m<19 / 19 < m .
Plot #3 compares the results obtained with the recipe discussed above and the real VVDS F02 radius distribution.
PLOT #3
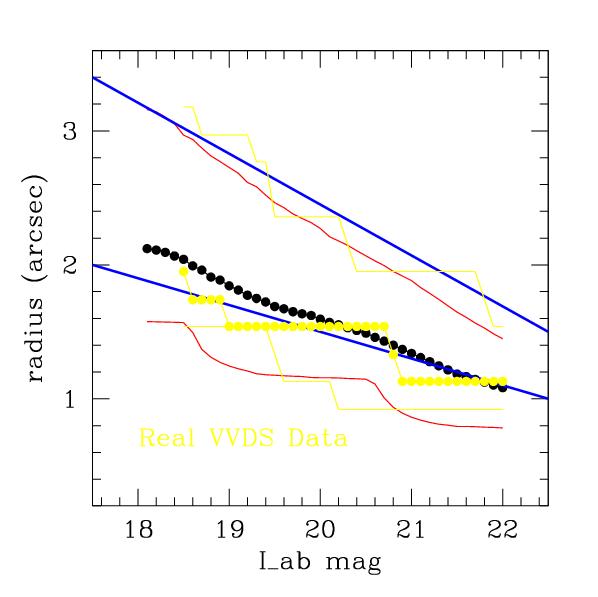
The agreement is quite good (the red lines are the 95 and 5 percentiles of the mock distribution, while the yellow are those of the real VVDS F02 data and the blue the fit we adopted).
After SPOC has been run on each mock catalogue, the final two steps consisted in:
1- removing 3 galaxies for each mask (12 galaxies per pointing) to take into account the holes used for the centering (and therefore not available for spectroscopy);
2- removing a further 15% of galaxies to take into account a realistic failure rate in redshift measurements.
PLOT #4
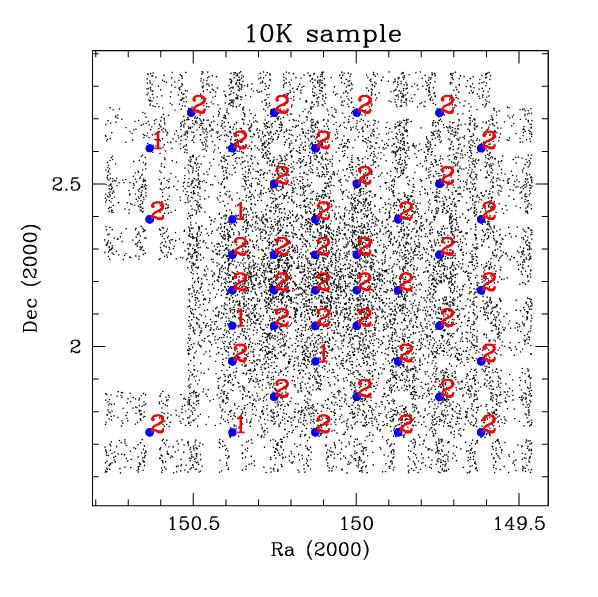
On the mean each 10K sample contains approximately 11500 galaxies.
A parallel strategy was adopted to create the 20K samples, those corresponding to the final 180 total pointings.
PLOT #5
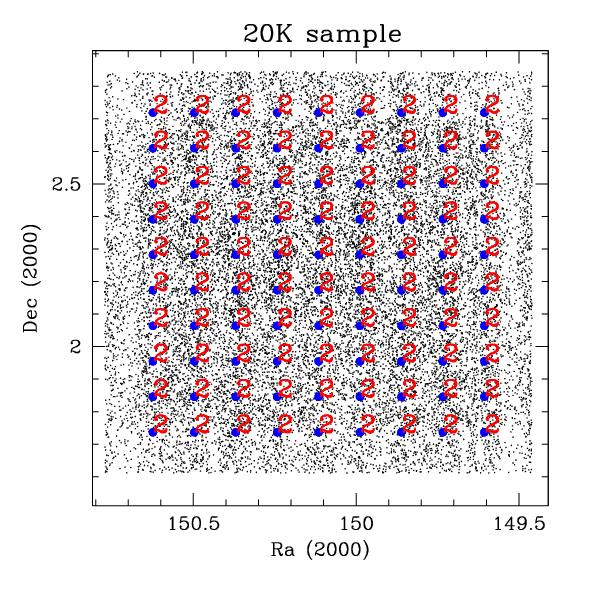
On the mean each 20K sample contains appox 21000 galaxies.
Plot
# 5 shows an example of a 20K mock sample (on top in red is the
number of observations of the corresponding pointing indicated by a
blue dot). In this plot the distribution of galaxies in the central
area (approximately 149.6 < ra < 150.62 and 1.7 < dec <
2.75) is much more homogeneous, obviously owing to the completion of
the observing strategy.
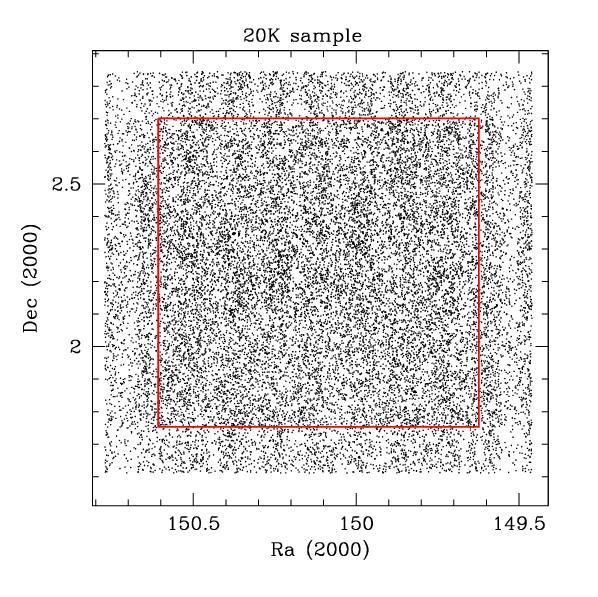
More
precisely the limits of the area where each galaxy had 4 chances to
be observed are:
The following plot shows a 20K sample with these limits
plotted with red lines on top:
 back to mock
catalogues page
back to mock
catalogues page