1- Out of a total of 10652 objects, 1799 have a spectroscopic flag F<2. These numbers seem to imply a 17% failure in redshift measurements if we use 2 as discriminant value.
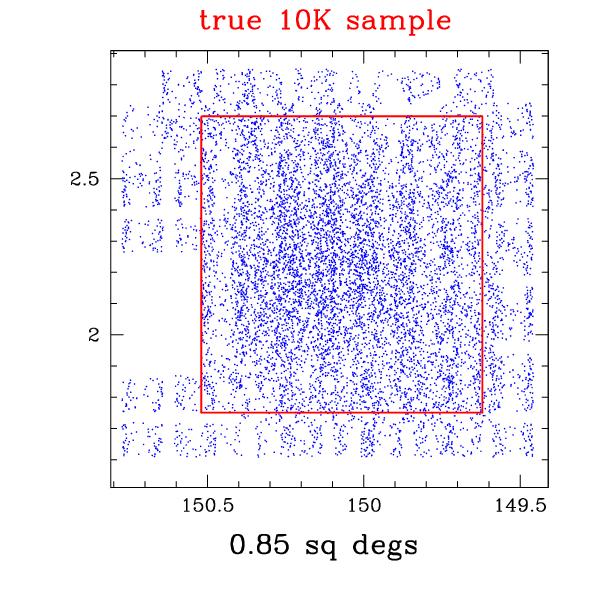
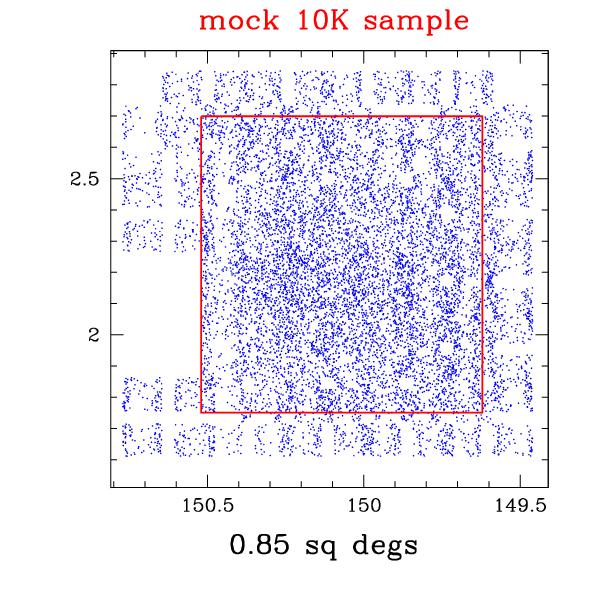
2- In the central area of 0.85 sq deg defined as:
149.62 < ra < 150.52
and
1.75 < dec < 2.70 (see the area delimited by the red lines shown in the plots below),
the
spectroscopic sampling rate is 0.42
(ratio of observed objects to
total objects in photometric catalogue, excluding stars, brighter than
15.0 objects and objects deleted after visual inspection: 8150 observed
objects and 19607 potential targets), while considering only
successful redshifts measurements the sampling rate goes down to
0.33 (6385
good redshift galaxies and 19607 potential targets - good
redshift means 2 <= z_flag <= 9.5 or 12 <= z_flag <= 19.5).
3- For the mocks catalogues the sampling rate, after applying SPOC and after considering 15% failure in redshift measurements, is higher (nearly 0.42). The surface density of galaxies brighter than 22.5 is similar in the real catalogue and in the mocks (it is ~ 24000 gals/sq deg in a mock and 22851 gals/sq deg in our photometric catalogue, after removing the objects mentioned before). Still 2 pointings are missing in our observed catalogue with respect to the mock catalogue (but probably not enough to raise the sampling rate to the values obtained for the mock catalogues). Maybe positioning compulsory slits can produce a slightly lower efficiency.
Here are the plots of the observed objects for a mock and for our V3.0 spectroscopic sample:
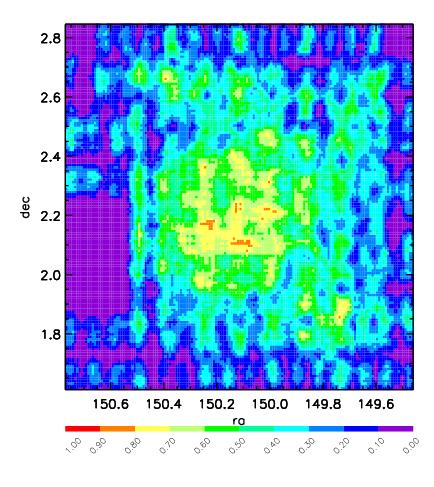
3- Here are two completeness maps for the real sample:
Considering only good quality redshifts:
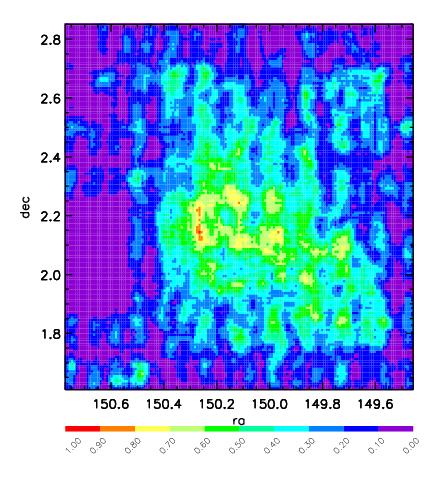
Or including all observed objects:
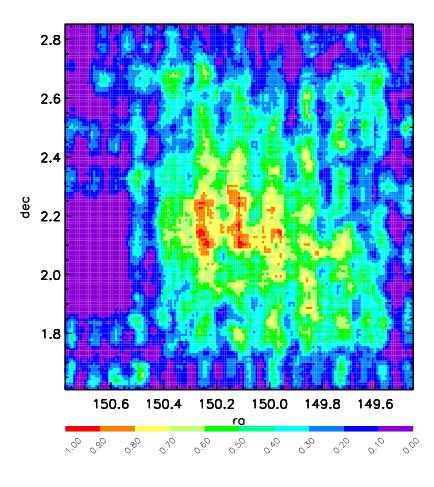
As a comparison here is the same map for one of our mock catalogues:
 back to
main page
back to
main page